
MACD Basics
MACD Strategies
Advanced MACD Techniques
Indicator Comparisons
Backtesting MACD Strategies: A Step-by-Step Guide for Traders
Before putting your money on the line, backtesting allows you to test your MACD strategies on historical data to see how they would have performed. It’s an essential process for building confidence, optimizing your approach, and avoiding costly mistakes. Why Backtest MACD Strategies? Step-by-Step: Backtesting a MACD Strategy Step 1: Define Your MACD Strategy Decide on: Step 2: Choose a Charting Platform Use platforms like: Step 3: Select Historical Data Step 4: Record Trades and Results Log each trade with: Step 5: Analyze Performance Example: Backtesting a Basic MACD Crossover Strategy Tips for Effective Backtesting FAQs – MACD Backtesting Guide 1.
Multi-Timeframe MACD Analysis: How to Align Trades for Better Accuracy
One of the most effective ways to improve your trade timing and accuracy is by analyzing MACD signals across multiple timeframes. This strategy helps you confirm the larger trend while spotting precise entry points on shorter charts. Why Use Multi-Timeframe Analysis? By checking MACD signals on both a higher and lower timeframe, you can enter trades with more confidence. Step-by-Step: Multi-Timeframe MACD Strategy Step 1: Choose Your Timeframes Example combos: Daily + 4H, 4H + 1H, 1H + 15m Step 2: Analyze the Higher Timeframe MACD Only trade in the direction supported by the higher timeframe. Step 3: Wait for Entry
MACD Filter for News Trading: Stay Safe During High Volatility
Trading during high-impact news events can be risky. Price spikes, slippage, and fake breakouts are common. One way to stay safe and smart during news volatility is by using the MACD as a filter. Why Use MACD for News Trading? News releases often trigger sudden price movements. The MACD helps: Step-by-Step: Using MACD to Filter Trades Around News Step 1: Know the News Schedule Check the economic calendar for high-impact events like: Avoid trading minutes before the news drops unless using a proven news strategy. Step 2: Analyze the Trend with MACD If MACD is flat or crossing frequently, stay out
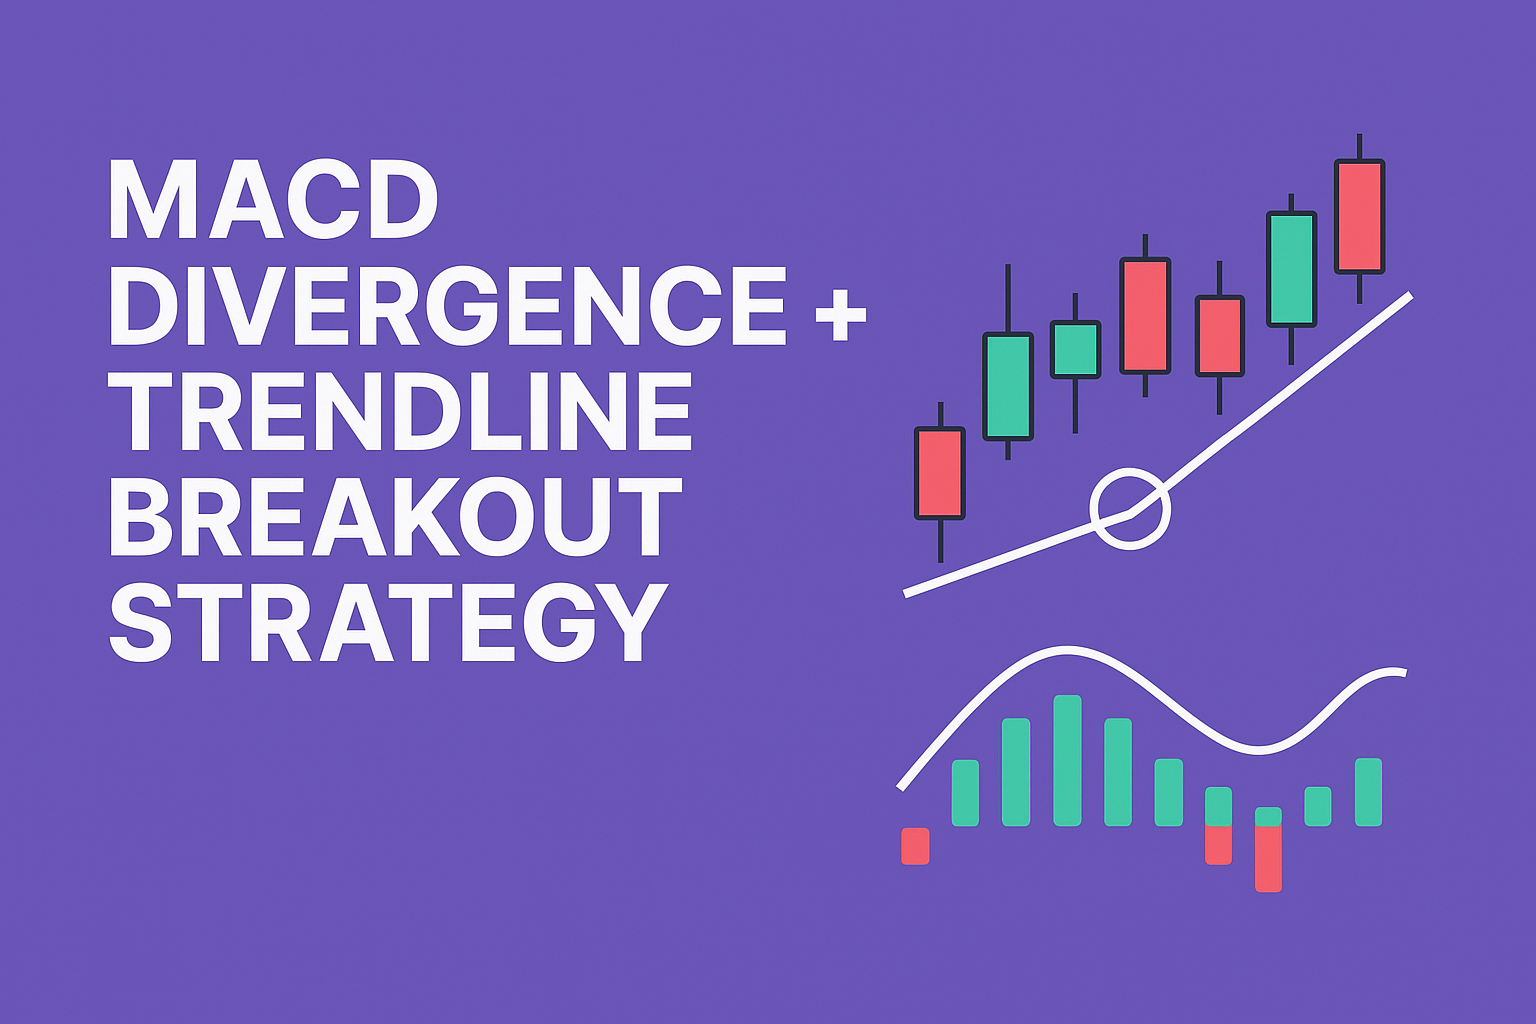
MACD Divergence + Trendline Breakout Strategy
Combining MACD divergence with trendline breakouts is a powerful technique that allows you to spot early reversals and time your entries more effectively. This strategy works by identifying weakening momentum (divergence) and waiting for confirmation through a price breakout. What is MACD Divergence? MACD divergence occurs when price moves in one direction, but the MACD indicator moves in the opposite direction: This signals that the trend is weakening and a reversal may be near. What is a Trendline Breakout? A trendline breakout happens when price breaks through a drawn trendline, signaling a potential trend change or continuation. When combined with divergence,
Backtesting MACD Strategies: A Step-by-Step Guide for Traders
Before putting your money on the line, backtesting allows you to test your MACD strategies on historical data to see how they would have performed. It’s an essential process for building confidence, optimizing your approach, and avoiding costly mistakes. Why Backtest MACD Strategies? Step-by-Step: Backtesting a MACD Strategy Step 1: Define Your MACD Strategy Decide on: Step 2: Choose a Charting Platform Use platforms like: Step 3: Select Historical Data Step 4: Record Trades and Results Log each trade with: Step 5: Analyze Performance Example: Backtesting a Basic MACD Crossover Strategy Tips for Effective Backtesting FAQs – MACD Backtesting Guide 1.
Multi-Timeframe MACD Analysis: How to Align Trades for Better Accuracy
One of the most effective ways to improve your trade timing and accuracy is by analyzing MACD signals across multiple timeframes. This strategy helps you confirm the larger trend while spotting precise entry points on shorter charts. Why Use Multi-Timeframe Analysis? By checking MACD signals on both a higher and lower timeframe, you can enter trades with more confidence. Step-by-Step: Multi-Timeframe MACD Strategy Step 1: Choose Your Timeframes Example combos: Daily + 4H, 4H + 1H, 1H + 15m Step 2: Analyze the Higher Timeframe MACD Only trade in the direction supported by the higher timeframe. Step 3: Wait for Entry
MACD Filter for News Trading: Stay Safe During High Volatility
Trading during high-impact news events can be risky. Price spikes, slippage, and fake breakouts are common. One way to stay safe and smart during news volatility is by using the MACD as a filter. Why Use MACD for News Trading? News releases often trigger sudden price movements. The MACD helps: Step-by-Step: Using MACD to Filter Trades Around News Step 1: Know the News Schedule Check the economic calendar for high-impact events like: Avoid trading minutes before the news drops unless using a proven news strategy. Step 2: Analyze the Trend with MACD If MACD is flat or crossing frequently, stay out
MACD Divergence + Trendline Breakout Strategy
Combining MACD divergence with trendline breakouts is a powerful technique that allows you to spot early reversals and time your entries more effectively. This strategy works by identifying weakening momentum (divergence) and waiting for confirmation through a price breakout. What is MACD Divergence? MACD divergence occurs when price moves in one direction, but the MACD indicator moves in the opposite direction: This signals that the trend is weakening and a reversal may be near. What is a Trendline Breakout? A trendline breakout happens when price breaks through a drawn trendline, signaling a potential trend change or continuation. When combined with divergence,